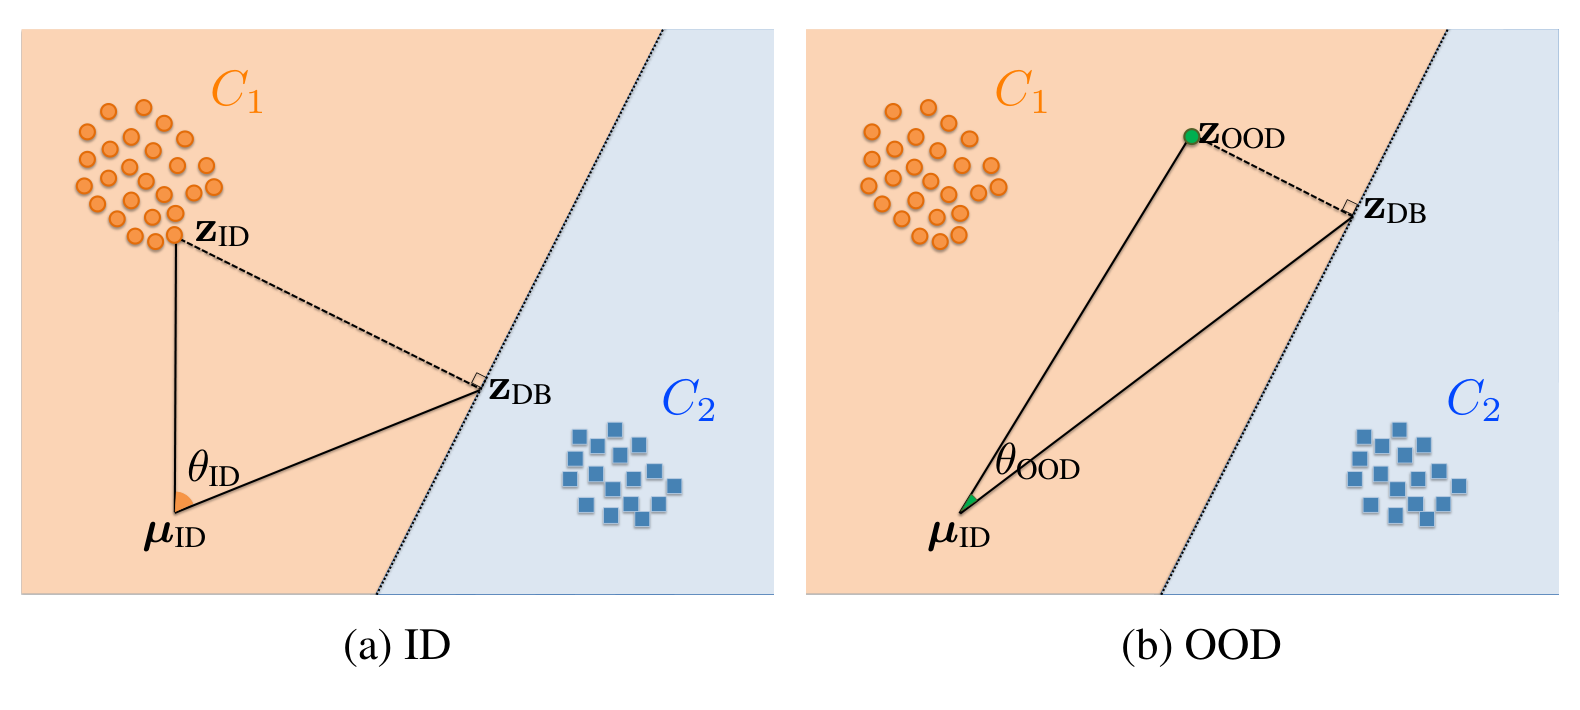
Post-hoc out-of-distribution detectors often score an input by how far its feature lies from the classifier's decision boundaries, but distances change with the scale of the feature space. ORA measures an angle instead. Seen from the mean of the in-distribution features, a confident in-distribution feature and its projection onto the boundary form a wide angle, while an out-of-distribution feature, closer to the boundary, forms a narrow one. The angle needs no hyperparameters and is unchanged when features are rescaled, which makes it flexible: it is especially strong on contrastively trained features, and scores from different models can simply be added into an ensemble. Across a wide range of architectures, ORA is consistently competitive.
A triangle in feature space
A classifier trained on a fixed set of labels will still put a label on an image from a class it has never seen. Out-of-distribution (OOD) detection asks it to notice instead. We look for a post-hoc score: one computed from an already trained network, without retraining, that is high for in-distribution (ID) inputs and low for everything else.
The decision boundaries suggest where to look. An OOD input carries no strong evidence for any class, so its feature should sit closer to a boundary than a typical ID feature does. Write the network as a feature extractor followed by a linear head \(g(z) = Wz + b\). The boundary between the predicted class \(\hat y\) and a competitor \(y'\) is the hyperplane where their logits tie, and projecting the penultimate feature \(z\) onto it gives a closed-form point \(z_{db}\).
The distance from \(z\) to \(z_{db}\) depends on how the feature space happens to be scaled, and an angle measured from the origin depends on where the origin happens to be. We remove both by moving the origin to the mean of the ID features, \(\mu_{ID}\). The centered feature, its centered projection and the new origin form a triangle, and the score is the angle at the origin, the relative angle:
ORA takes the largest of these angles over all competitors \(y'\), the boundary that is furthest away as seen from the ID mean. A feature deep inside its class forms a wide angle, because changing its label would be costly; one that drifts toward a boundary forms a narrow one.
Penultimate feature space
- class C1
- class C2
- decision boundary
- test feature z
Relative angle
Scale the feature space: the distance to the boundary grows and shrinks with it, the angle does not. That invariance is what lets ORA sum scores across models.
What the angle buys
Given a pretrained model, ORA is fully determined: there is nothing to tune. It is also scale-invariant in a precise sense. If one encoder's features are a scaled copy of another's, \(z_{M_2} = k\, z_{M_1}\) with \(k > 0\), and both share a bias-free linear head, the two models make the same decisions and have identical relative angles, while their distances to the boundary differ by the factor \(k\) (Appendix C of the paper). Distance-based scores from different networks live on different scales; ORA scores can be compared, and added, directly.
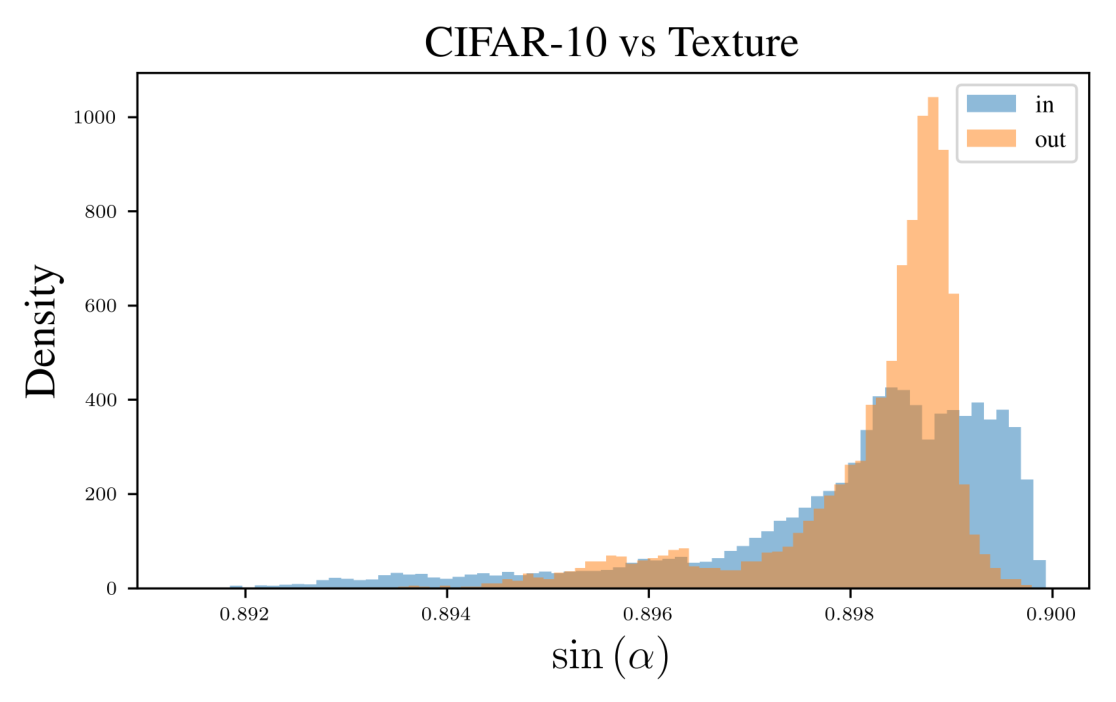
The triangle also explains the closest earlier score, fDBD of Liu and Qin, which divides the distance to the boundary by the distance to the ID mean. Both lengths are sides of our triangle, and fDBD turns out to combine our angle with another angle of the same triangle, one whose values barely differ between ID and OOD data. Dropping that second angle leaves the relative angle (details below).
How it holds up
Most ImageNet OOD benchmarks report a ResNet-50 alone. We compare ORA with twelve other post-hoc scores on nine backbones instead, convolutional and transformer, trained on ImageNet alone or pretrained on larger data, including a ResNet-50 trained with a supervised contrastive loss (SCL).
| Method | ResNet-50 | EVA | Average | |
|---|---|---|---|---|
| plain | SCL | |||
| MSP | 66.95 | 50.06 | 43.75 | 54.78 |
| R-Mah | 83.29 | 77.52 | 27.45 | 49.50 |
| P-Cos | 45.53 | 31.57 | 27.68 | 41.52 |
| fDBD | 51.19 | 32.78 | 36.10 | 43.90 |
| ORA | 43.63 | 25.04 | 33.37 | 38.34 |
No score wins everywhere, ORA included. What sets it apart is consistency: it has the best average over the nine backbones, while scores that shine on one backbone can fall apart on another.
ORA is at its strongest on contrastively trained features, which arrange the space so that classes are well separated, and there it is the best detector on both CIFAR-10 and ImageNet. It also carries over to CLIP, with a linear probe or zero-shot, where the text embeddings of two classes define the boundary between them; zero-shot it is competitive but not the best.
Because the angle does not depend on scale, scores from different networks can be summed directly, and an ensemble of three models beats its best member. ORA also combines with activation-shaping methods such as ReAct, which lower its error further.
Where it falls short
ORA needs decision boundaries. It is defined for models with a linear classification head, or for vision-language models whose text embeddings can stand in for one; a plain feature extractor has nothing to project onto.
Near-OOD is harder for every method. On NINCO and SSB-Hard, where OOD images look like ID classes, all scores lose separability, no single one is clearly best, and methods built on class centroids tend to do better at the cost of storing per-class statistics. ORA, which uses only the global ID mean, is competitive with them (Appendix I of the paper). Centering on per-class means instead gave no consistent gains; a data-driven weighting of per-class angles that keeps the score hyperparameter-free is the natural next step.
Technical details
Projecting onto a boundary
The boundary between classes \(y_1\) and \(y_2\) is \((w_{y_1}-w_{y_2})^\top z + b_{y_1}-b_{y_2} = 0\), where \(w_y\) and \(b_y\) are the rows of \(W\) and entries of \(b\). Projecting a feature onto it gives
For zero-shot CLIP, the boundary between classes with text embeddings \(z_{c_1}, z_{c_2}\) is the set of normalized features equally similar to both. With \(u = (z_{c_1}-z_{c_2})/\lVert z_{c_1}-z_{c_2}\rVert\), the projection is \(z_{db} = z - \langle z, u\rangle u\).
fDBD and the law of sines
Distances are translation-invariant, so both lengths in the fDBD score are sides of the triangle formed by \(z-\mu_{ID}\), \(z_{db}-\mu_{ID}\) and the origin. By the law of sines,
with \(\theta\) the relative angle and \(\alpha\) the angle opposite \(z-\mu_{ID}\).
Ablations
Centering on the global ID mean beats centering on the predicted-class mean, the true-class mean, or the maximum of the ID features, and taking the maximum angle over boundaries beats the mean or the minimum.
| Variant | CIFAR-10 | ImageNet |
|---|---|---|
| Centering point | ||
| Predicted-class mean | 12.42 | 43.02 |
| True-class mean | 13.26 | 28.29 |
| Maximum of ID features | 13.39 | 32.44 |
| ID mean (ORA) | 10.97 | 25.04 |
| Aggregation over boundaries | ||
| Minimum | 32.02 | 79.15 |
| Mean | 11.84 | 32.76 |
| Maximum (ORA) | 10.97 | 25.04 |
Citation
@inproceedings{
demirel2025ood,
title={{OOD} Detection with Relative Angles},
author={Berker Demirel and Marco Fumero and Francesco Locatello},
booktitle={The Thirty-ninth Annual Conference on Neural Information Processing Systems},
year={2025},
url={https://openreview.net/forum?id=ul5mlXrLZb}
}